This is an infrared remote control extender I built. There are a couple of minor differences but in general it follows this design.
This is an infrared remote control extender I built. There are a couple of minor differences but in general it follows this design.
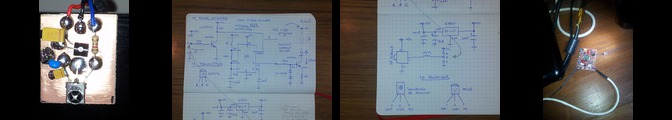
Here’s a little amplifer to be incorporated into the AM superhet radio I’m building:
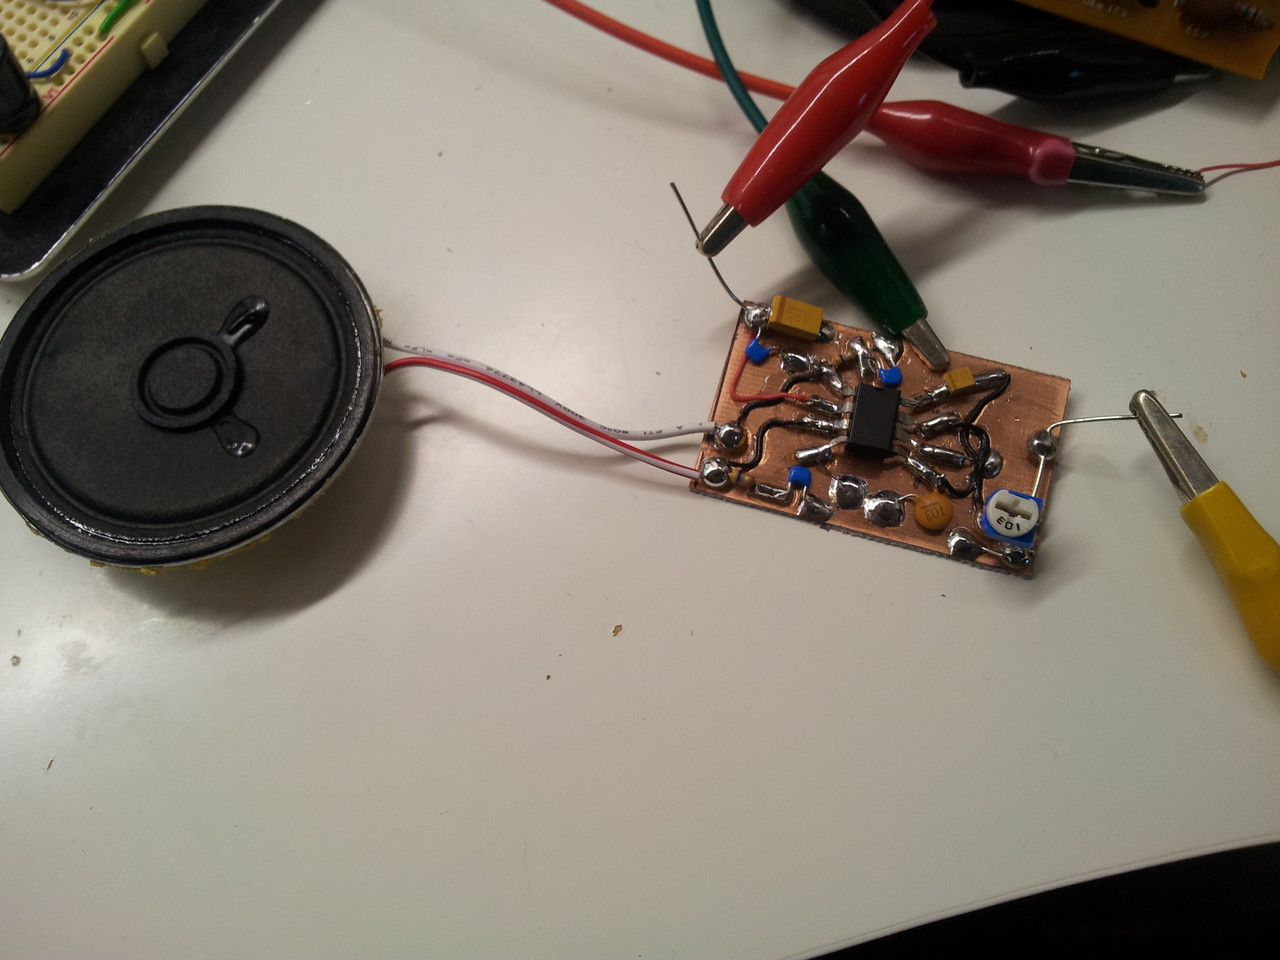
It’s based on the TDA2822M stereo amplifier chip. In my case the chip is actually a clone marked CD2822 pulled from a very cheap radio. (The irony of destroying a radio to make a radio is not lost on me).
This post documents my build of the 8 transistor AM superhetrodyne receiver featured in Ronald Quan’s excellent book Build Your Own Transistor Radios. In reality, my version is a 4 transistor radio since I’ve used an audio amplifier chip in place of the 4 transistor amplifer used in the original design. The main reason for the change was that I did not have the audio transformers required for the original design on hand.
Here’s my take on a GPIO cable for the Raspberry Pi that can be used with solderless breadboards:

The cable uses a 26-way IDC header socket (available here in Australia from Jaycar, PS0987). I recycled the wire from a 40-pin hard drive cable I had in the junk box (with the 14 excess wires peeled off). You could just as easily use 26-way cable (such as Jaycar WM4504).
It seems every time I have a new laser cutting project in mind, Ponoko is running a special. This time it was a generous 30% off making costs as part of Cyber Monday.
I’m making lampshades for my daughter’s doll’s house. The lower rooms, in particular, are very dark and badly in need of some illumination.

Like last time, I’ve specified my design in Processing . This was really quick to do and should produce 5 neat little lampshades that will each contain a star LED module. Wires running to the lampshades will be concealed in brass “conduit” with little brackets to keep the conduit in place. Everything will be affixed to the doll’s house with self-tapping screws.
There was some space left over so I added a little Christmas star, which will contain a colour-changing LED, for fun.
Update 21 November 2012: My Ponoko order arrived yesterday. It is proof that the technique works - all lines were cut perfectly, the engraving looks great, and the text is raster engraved beautifully. See below for the ocular proof.
I really like Ponoko’s laser-cutting service. It’s a breeze to use and the customer support is excellent. With it, I can now create custom enclosures for my electronics projects, bringing a new level of professionalism to their finish.
The only bit I find hard is capturing my designs in the vector graphics tool Inkscape. This is clearly an immensely powerful program with a plethora of features. Mastering such programs seems to involve setting oneself up for success, becoming intimately familiar with what each tool does, picking up lots of tricks, and memorising all the shortcut keys. It’s a significant time investment and a steep learning curve; and because I only design enclosures every now and then, it takes a while to reacquaint myself with all these things.
A lot of my designs involve repeating elements - equally spaced mounting holes, for instance. This repetition led me to ask whether I could specify my designs programmatically. I’m comfortable with programming, and certainly more adept at it than I am at using a vector graphics tool!

Specifying a design in code seemed to bring with it a number of advantages:
Point perfect positioning. Ability to specify precise coordinates and no risk of “bumping” shapes out of their intended place.
Built in workflow. Possible to set a flag and change from “design” mode, with guidelines and annotations shown and thick lines for printing, to “production” mode, with only the details to be cut/engraved shown and thin lines for the laser cutter.
Versioning. Standard source control tools, like Git and SVN can be used.
Public transport friendly! It’s quite feasible to type on a bus or train; much harder to use a mouse to create precise graphics.
This visualisation explores the growth of research data collections in ANDS Research Data Australia (RDA) over time. We were interested in who contributed collection records in what disciplines when.
The visualisation gives us insights into questions such as:
Who got the ball rolling?
When were there bursts of activity?
How did RDA grow over time?
What did the discipline coverage look like at any point in time?
What you’re seeing are collections grouped by contributing research institution and then by top-level Field of Research (FOR) code.
Each cluster represents an institution.
Each colour represents an FOR code.
Each dot represents a collection
This visualisation was produced by Luc Small and Jared Berghold as part of the 2012 eResearch Australasia conference Developers Lounge Challenge.
It makes extensive use of the source code visualisation tool Gource as discussed further below. Gource is great for viewing the contribution of actors (usually developers) to (source code) repositories over time. RDA is effectively a repository, and the contributing institutions are actors, so Gource is a perfect tool for visualising its growth over time.
The data was sourced from the Australian National Data Service (ANDS) and used under a Creative Commons Attribution 3.0 Australia License.
We also acknowledge the work of J Lang, whose song “The Garden of Forking” is used here and has been made available under a Creative Commons Attribution Noncommercial (3.0) License.
Enthused by the success reported in this blog post, I purchased a couple of Wi-Fi wireless N USB dongles from this ebay seller for use with my Raspberry Pi:

The chipset in this dongle is the Ralink RT5370:

In a recent post, I wrote about reverse engineering the protocol used by the WH2 outdoor wireless weather sensor that came with my weather station. I was able to use the excellent Saleae Logic to capture several transmitted packets under various conditions (i.e. for different temperature and humidity readings). But in order determine which parts of the packet were changing for a given change in the readings, I needed to present the captured packets side-by-side.
To accomplish this task, I used the Logic’s data export facility and GNUPlot. In this post, I present a tutorial-style account of what I did. The idea for this tutorial came from a comment I received in response to that earlier post.
The first step is to capture your data using the Logic. Ensure that each time you sample, you maintain the same sample rate. Use the start (T1) and finish (T2) markers to mark the beginning and end of your packet, as follows:

In the previous posts in this series, I described the process of reverse engineering the WH2 wireless outdoor sensor that is bundled with some Fine Offset Electronics weather stations, and the protocol used by these sensors. In this part I demonstrate how to use the Arduino to receive and decode the packets.
Update 19 December 2013: Please see this post for a sketch that supercedes the code below.
To simplify the operation of receiving and decoding packets, I’ve created an Arduino library. This is available on Github. The library includes a test harness in the examples folder. The test harness shows how to setup and call the library’s functions and writes a summary of each received packet to the Arduino’s serial port. Just wire up the circuit below, install the library, open the TestHarness example, compile and upload it to your Arduino, and open the Serial Monitor window of the Arduino software. (Note: It could take up to 48 seconds for the TestHarness to receive a packet from a WH2 sensor in range.)
