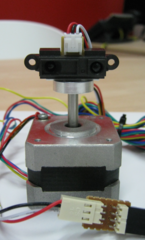
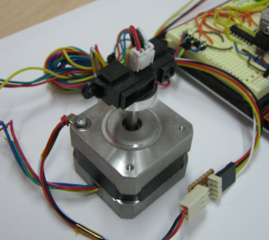
Having cultivated a bit of an interest in robotics over the past few months, I bit the bullet and ordered a Sharp GP2Y0A21YK Infrared Proximity Sensor. This produces an analog voltage output that varies in relation its distance from objects in its sight. Here’s what it looks like (mounted atop a stepper motor):
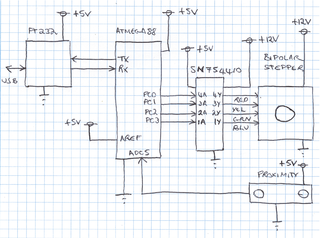
I needed a circuit to test it out, so here’s what I came up with:
The basic idea was to use a trusty Atmega88 micro to drive a bipolar stepper motor via a rugged SN754410 dual H-bridge driver IC. The micro was programmed to make one full rotation counter-clockwise slowly and then return to its “home” location by turning clockwise one full rotation.
The proximity sensor was mounted atop the stepper motor. During the slow scan, I set the Atmega88 to sample its 10bit ADC on channel ADC5 - which was connected to the proximity sensor’s output - after each step of the stepper motor. The ADC readings for each step (220 in all) were sent to a computer for logging via the FT232 Serial-to-USB converter.
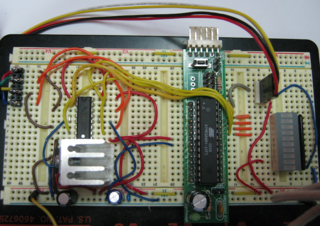
Here’s the layout on the breadboard, with the Atmega88 mounted on the green PCB, the SN754410 to the mid-left, a +5V regulator immediately below it on a heatsink, and some LEDs to the right to show the status of the drive channels for the stepper motor. The FT232 is not shown - it’s mounted on a separate breakout board that connects to the 6-pin header on the green PCB:
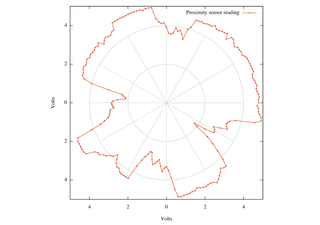
Here’s the result of plotting the acquired distance data using GNUPlot’s polar graphing capabilities:
In this case there were four obstacles placed on a clear table around the proximity scanner. The object at top was the furthest away - the objects to the left, right, and bottom were considerably closer. Looks like the sensor works well!
There are four things to note about the graph above:
The 10-bit ADC reading (0-1023) has been converted to a voltage between 0 and 5V.
The actual measured voltage was subtracted from 5V. Otherwise the graph would appear inverted, because the sensor output voltage drops with increasing distance.
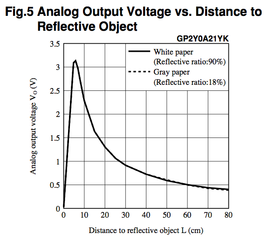
The data graphed has not been corrected for the significant non-linearity of the sensor’s voltage-to-distance response, as illustrated in the graph below from the GP2Y0A21YK datasheet. This means that the closeness of the closest objects is somewhat exaggerated.
The graph does not compensate for the fact that the highest voltage output by the proximity sensor is +3.1V and the ADC is referenced to +5V. In this case it means that the closeness of the closest objects is somewhat under-exaggerated - in some ways compensating for the previous effect!
The solution to this is to derive a formula for the voltage-vs-distance curve (regression analysis) and to plot the distance for the measured voltages. Nevertheless, this quick test shows that the sensor performs well.
